Tuesday, November 24, 2009

Peaking Bonds Signal Impending Market Correction


CLICK HERE to view report in original format.


It is necessary to understand what equity, debt, forex and commodity markets are signaling. I highly recommend reading John J. Murphy’s Intermarket Analysis as you will better understand the intermarket correlations and relationships. You will be in a better position to identify market tops, bottoms, reversals, leading asset classes, and other factors that improve your analytical visibility.


As I covered in TNX v. DJIA- Intermarket Analysis, bonds lead the stock market. Its not necessary that we look for stocks to follow the same script as bonds. However, once we identify certain patterns in bond yields, we can use this knowledge to expect and be prepared for certain events in the stock market.


As shown in Figure 1, the double top has bearish implications for the stock market. I might be reading early into this. This may even be a consolidation phase after which bond yields may resume their previous uptrend. However, I’ll stay on the neutral-bearish side for the moment.


Figure 1


You cannot pinpoint the time when stocks will reverse. However, you will be ready for the reversal. For instance, if liquidity is an issue, then you can start by reducing your bullish exposure. Or if you can wait till you see a confirmation of a retracement, then you can make the most of the bullish rally and then change your stance to either cash or shorts.


-Sanjeet Parab


______________________________________________


Tuesday, November 10, 2009

2009.08.06- NIFTY Performance Feedback


NIFTY- AUGUST 6, 2009 PERFORMANCE FEEDBACK


Initial Forecast


Actual Price Action


Figure 1: August 6, 2009 Forecast


Figure 2: Nifty Actual Price Action


Figure 3: Trend Lines Proving as Support Levels as Forecasted


Initial Forecast


CLICK HERE to view the initial forecast.


In my NIFTY- August 6, 2009 forecast I wrote:


§       You can expect NIFTY to retrace to the RED trend line identified in Figure 1.


§       The RED line should support prices. Yet, an even more significant supporting trend line is the green trend line.


Figure 1: August 6, 2009 Forecast


Return to Top / NIFTY Home / Technical Analysis Base Home


Actual Price Action


§       The RED trend line, as shown in Figure 2 and Figure 3, momentarily proved as support. Upon downside penetration of this trend line, it reversed its role and resisted the NIFTY from significantly penetrating above it.


§       Furthermore, the GREEN trend line supported the NIFTY until October 22, 2009- 77 days after my forecast.


§       In my forecast I had written that a downside penetration of this green trend line should see the NIFTY carry down to 3900. Just to clarify, this would be valid if the green line had not supported NIFTY at that time. Now the retracement levels will be different. Thus, the 3900 retracement is no more valid.


Figure 2: Nifty Actual Price Action


Figure 3: Trend Lines Proving as Support Levels as Forecasted


Return to Top / NIFTY Home / Technical Analysis Base Home


Sanjeet S. Parab


____________________________________


Saturday, November 7, 2009

2009.11.07- MSFT


MSFT (TECHNOLOGY/APPLICATION SOFTWARE)


    Price Objectives


Intermediate-term Outlook


Rationale


Lower Price Objective


Figure 1:  Identifying Resistance on a 10-Year Monthly Chart


Figure 2: Fibonacci Studies


Figure 3: Evident Price Gaps


Price Objectives 


Extreme Upper Bound


38.07: 2001 High Retested in 2007  (Figure 1)


Upper Bound


29.35: October 23, 2009 High (Figure 2)


Current Price


28.52


Lower Bound


~ 23.84: Inflection point at the 38.2% Retracement Level (Figure 2)


Extreme Lower Bound


~ 20.5: Significant Inflection point (Figure 2)


Return to TOP / STOCK ANALYSIS STATION / HOME


Intermediate-term Outlook 


  • Bearish


Return to TOP / STOCK ANALYSIS STATION / HOME


Rationale 


  • As Figure 1 shows, MSFT faces significant resistance at the ~30 level. Even though this level was penetrated on several occasions, its significance is proven because MSFT was unable to penetrate above it on its previous attempt on October 23, 2009 when it made a high of 29.35.
  • MSFT is likely to retrace a portion of its previous rally because the 61.8% confluence zone (Red circles in Figure 2) resisted MSFT from breaking out.
  • As I identify in Figure 3, MSFT is correcting after the occurrence of the Exhaustion Gap.


  • In sum, the three factors listed above- (1) resistance at ~30, (2) resistance at the 61.8% confluence zone, and (3) Exhaustion gap – give me greater confidence in forecasting a retracing MSFT in the intermediate term.


Return to TOP / STOCK ANALYSIS STATION / HOME


Lower Price Objective 


  • The question then is that if MSFT follows my outlined script, then what are the lower price objectives?
  • ~24: This level is a major inflection point because both the 38.2% confluence zones coincide almost perfectly at this level. Refer to Figure 2.
  • ~20.5: A 61.8% confluence zone and a major support level that started in late 2000 coincide near perfectly to form a significant inflection point. Refer to Figure 1.


Return to TOP / STOCK ANALYSIS STATION / HOME


Figure 1:  Identifying Resistance on a 10-Year Monthly Chart


Return to TOP / STOCK ANALYSIS STATION / HOME


Figure 2: Fibonacci Studies


Return to TOP / STOCK ANALYSIS STATION / HOME


Figure 3: Evident Price Gaps


Return to TOP / STOCK ANALYSIS STATION / HOME


-Sanjeet S. Parab


__________________________________________________


Sunday, October 4, 2009

DJIA Status Update- October 4, 2009

Unlike my other DJIA Forecasts on the Technical Analysis Base website, this is not an extensive analysis of the DJIA.

Major Indicators:

  • Resistance evident at ~10K level (Figure 1).
  • Log Charts (Figures 1 & 4): DJIA is touching the up trending support line. If DJIA bounces off the up trending support line, then our intermediate-term price target will be near the upper channel line (Figure 1).
  • Arithmetic Charts (Figures 2 & 3): DJIA is fast approaching the up trending support line . Upon downside penetration of this support line, you may expect DJIA to retrace to the support levels identified in Figure 1 and/or the Fibonacci confluence levels in Figures 2, 3 and 4.

Near-Term DJIA Forecast:

  • Log Charts: A bounce off of the supporting up trend line.
  • Arithmetic Charts: Expect DJIA to approach the supporting up trend line- Green oval identified in Figure 3.

Bearish Signals:

  • DJIA's inability to reach the upper channel line (Figure 1).
  • Downside crossover of SMA-50 (Figure 1).
  • Negative MACD Divergence (Figure 3).
  • RSI crossing below the signal line (Figure 3).

Bullish Signals:

  • SMA-50 potentially acting as a support level.
  • Since DJIA is at the lower Bollinger Band, we can expect DJIA to rally toward the upper band (Figure 1).
  • Supporting up trend line (Figure 1).

Figure 1 (Log Scale)


Figure 2 (Arithmetic Scale).


Figure 3 (Arithmetic Scale).

Figure 4 (Log Scale).


Don't forget to visit Technical Analysis Base website at http://www.technicalanalysisbase.com and Sanjeet Parab Blog at http://sanjeetparab.blogspot.com

-Sanjeet Parab

________________________________


Tuesday, August 11, 2009

Log charts?

I was going over my NIFTY August 6, 2009 forecast, and much to my delight, my forecast of a retracing NIFTY came true. Unlike my other forecasts, I didn't identify bounds/price objectives. Instead, I drew an upsloping trendline that would support the correction.


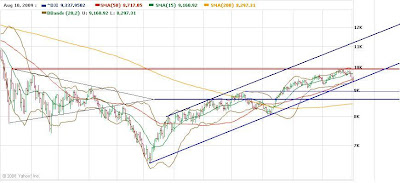
Today, I was toggling between log and arithmetic charts and observed that a trendline that may have proved to support/resist prices on a log chart may not act as the same on an arithmetic chart. Observe the image below.


So, which chart should I use? And which chart should you use in the long term?

I suggest using log charts for long-term analysis and arithmetic charts do a good job on intermediate- and near-term analysis.

Don't forget to visit
Technical Analysis Base at http://www.technicalanalysisbase.com and
Sanjeet Parab Blog at http://sanjeetparab.blogspot.com

Sanjeet Parab
__________________________

Thursday, August 6, 2009

NIFTY- August 6, 2009

To view my analysis on NIFTY, CLICK HERE or GO TO: http://www.technicalanalysisbase.com/nifty/nifty--august-6-2009

Also visit:

My Website: http://www.technicalanalysisbase.com and
Sanjeet Parab Blog at http://sanjeetparab.blogspot.com

Sanjeet Parab
_______________________________________

Tuesday, August 4, 2009

SPX- Intermediate-Term Outlook

CLICK HERE to view Complete Report which includes the charts identifying major inflection points and chart patterns.

Bearish Case:

  1. If I’ve identified the chart patterns correctly, then my intermediate term outlook is bearish.
  2. The ascending wedge identified in Figure 1 (SPX Chart) has major bearish implications.
  3. Be aware of the characteristic throwover (whipsaw/false breakout) that the Elliott Wave Principle often cautions against. Apply the 2-day or 3% filters before taking bullish positions or place stops to protect major losses because the moves after wedge penetrations are often significant.
  4. Complementing this bearish outlook is the descending wedge on the VIX Chart in Figure 2. The descending wedge implies a potential increase in volatility as VIX penetrates the wedge to the upside. Because VIX and SPX are negatively correlated, a rallying VIX has major bearish implications for the SPX.
  5. Resisting Factors:

    1) 38.2% Confluence Zone at 1,016.14
    2) Upper Trend line of the Ascending Wedge currently coinciding with the 38.2% Zone identified in point (1)
    3) Significant resisting down trend line starting from the October 2009 peak
    4) 50% Confluence Zone at 1,056.19.

    § It appears that the current rally is Wave 5 of the first impulsive Wave. Thus, a rather rapid retracement down to the 860 level can be expected.


Bullish Case:

  1. H&S Bottom- SPX penetrated the neckline.
  2. The ascending wedge identified in Figure 1 may indeed be a leading triangle in Wave 1 of an impulse.
  3. Thus, any correction will be supported by the neckline or the lower trend line of the wedge/leading diagonal.
  4. Supporting Factors:

    1) H&S Bottom Neckline
    2) Ascending Wedge Supporting Trend Line
    3) 38.2% Confluence zone at ~969

Outlook:

  • Depending on your risk tolerance, make your moves before/after prices confirm the next relative direction.
  • My intermediate term outlook is bearish because the next wave is most likely going to be corrective in both the bearish and the bullish cases.
  • Bullish Case: Return move to the neckline- Bearish implications
  • Bullish Case: Leading Diagonal in Wave 1- Bearish implications because Wave 2 is corrective in nature
  • And I’ve outlined my bearish factors and reasoning under the Bearish Case

Don't forget to visit Technical Analysis Base website at http://www.technicalanalysisbase.com/ and Sanjeet Parab Blog at http://sanjeetparab.blogspot.com/

Sanjeet Parab

_______________________________