

Major Indicators:
- Resistance evident at ~10K level (Figure 1).
- Log Charts (Figures 1 & 4): DJIA is touching the up trending support line. If DJIA bounces off the up trending support line, then our intermediate-term price target will be near the upper channel line (Figure 1).
- Arithmetic Charts (Figures 2 & 3): DJIA is fast approaching the up trending support line . Upon downside penetration of this support line, you may expect DJIA to retrace to the support levels identified in Figure 1 and/or the Fibonacci confluence levels in Figures 2, 3 and 4.
Near-Term DJIA Forecast:
- Log Charts: A bounce off of the supporting up trend line.
- Arithmetic Charts: Expect DJIA to approach the supporting up trend line- Green oval identified in Figure 3.
Bearish Signals:
- DJIA's inability to reach the upper channel line (Figure 1).
- Downside crossover of SMA-50 (Figure 1).
- Negative MACD Divergence (Figure 3).
- RSI crossing below the signal line (Figure 3).
Bullish Signals:
- SMA-50 potentially acting as a support level.
- Since DJIA is at the lower Bollinger Band, we can expect DJIA to rally toward the upper band (Figure 1).
- Supporting up trend line (Figure 1).
Figure 1 (Log Scale)
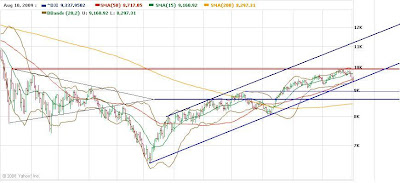
Figure 2 (Arithmetic Scale).

Figure 3 (Arithmetic Scale).

Figure 4 (Log Scale).

Don't forget to visit Technical Analysis Base website at http://www.technicalanalysisbase.com and Sanjeet Parab Blog at http://sanjeetparab.blogspot.com
-Sanjeet Parab
________________________________
No comments:
Post a Comment